Module 4 · Query optimization
Episode 31 Lab: Fast Yesterday, Slow Today
▶ This video is coming to YouTube soon.
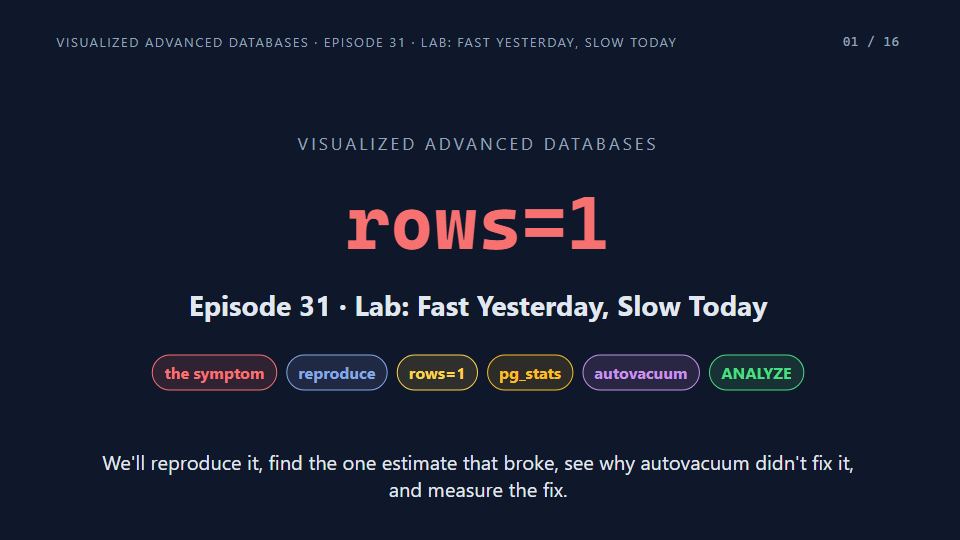
A dashboard query went from 0.8 ms to 448 ms after a bulk import, with no change to the query. We reproduce it on Postgres, read the plan (estimated rows=1, actual 119,511), rebuild the planner's estimate from pg_stats and pg_class, see why autovacuum's thresholds didn't help, and fix it with ANALYZE: 837,416 page touches down to 4,377.
Chapters
- 0:00Intro
- 0:14The symptom
- 0:40Reproduce: yesterday's table
- 1:04Yesterday: rows=1, and it was right
- 1:31Reproduce: the overnight import
- 1:44Today: the same plan, 119,511 times
- 2:24Diagnose: the statistics are from yesterday
- 2:54Where rows=1 comes from
- 3:36Why a nested loop looked right
- 4:02Why autovacuum didn't save us
- 4:42The fix: ANALYZE
- 4:56After ANALYZE: the plan flips back
- 5:18Before and after
- 5:48Keep the statistics fresh
- 6:26Recap
- 6:55Next: ACID and Schedules